Showing Our True Colors: TM-30 and the Styllus Linear™ Series
Read the TM-30 color rendering evaluation of our Styllus Linear™ Series.


Consider this product description: “Created with architects and lighting designers in mind, Cree Lighting’s new Styllus Linear™ Series offers sleek seamless lines, brilliant color quality and ultra-smooth dimming down to 1%.”
Sounds like a great product. But what if you want more details on “brilliant color quality”? A quick look at the specs tells you the Styllus Linear™ Series offers a CRI of 90 or better – an excellent score for general office lighting and good enough for most color-critical applications. You’d also see a metric for R9>65 that describes how the Styllus Linear™ Series renders reds, since oversaturated reds are desired in many settings.
Until recently, the CRI index and an R9 value was probably all the information you’d have on how the Styllus Linear™ Series – or any other luminaire – renders color. But you know from experience that CRI doesn’t always match up well to color perceptions, and especially may not reflect color preferences. The R9 value tells you the Styllus Linear™ Series will render pleasing reds, but unless you order a sample luminaire and evaluate colors with your own eyes, you can’t accurately predict how other hues across the visible spectrum will appear in your specific application.
All that’s changed, thanks to the TM-30 color rendering evaluation method. If you’re familiar with TM-30, you already know how useful it can be when comparing the relative color-rendering merits of various fixtures, and in finding luminaires with the right color rendering characteristics for a given application. If you’re not familiar with the origin and meaning of the TM-30 indices, fill out the form to view the FAQ.
Cree Lighting has published TM-30-18 information on the Styllus Linear™ Series 3000K, 3500K and 4000K versions using the IES recommended format – a full-page “TM-30 Color Rendition Report” including color rendering details for all 99 individual color samples and TM-30’s 16 standard hue bins. Let’s look at the major elements of that report and what they tell us.
1 - The spectral power distribution (SPD) for the light source. This is what is fed into the TM-30 calculator engine.
2 - The Color Vector Graphic, with major numerical indices posted to the corners of the color space (more on those below).
3 - Color fidelity scores for each of the TM-30’s 99 color samples.
4 - Color rendering information showing the average shifts in hue, chroma (saturation) and fidelity across TM-30’s 16 standard color bins.
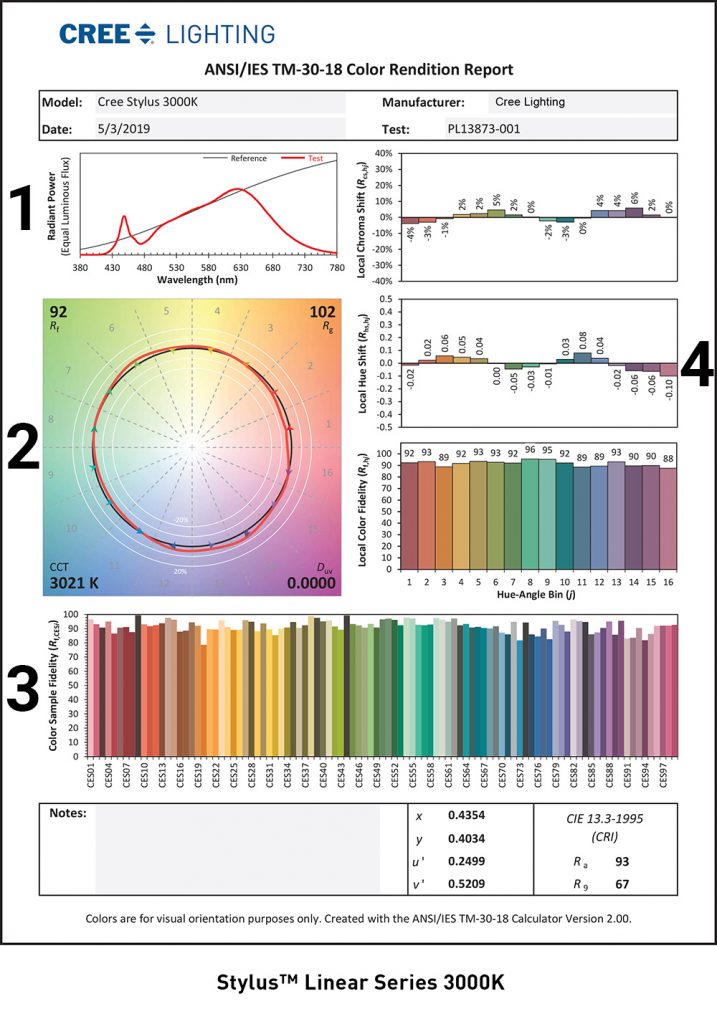
The TM-30 method generates two major numeric indices – Rf for color fidelity (0-100 scale) and Rg for gamut (0 to greater than 100). These appear in the upper left and right corners of the Color Vector Graphic. The CCT of both the observed light and reference source can be found in the lower left corner, and Duv, or Distance from the Black Body Locus at the lower right.
In many instances, Rf, Rg and the Color Vector Graphic plots may tell you all you need to characterize the color-rendering properties of a light source. Here’s what those elements reveal.
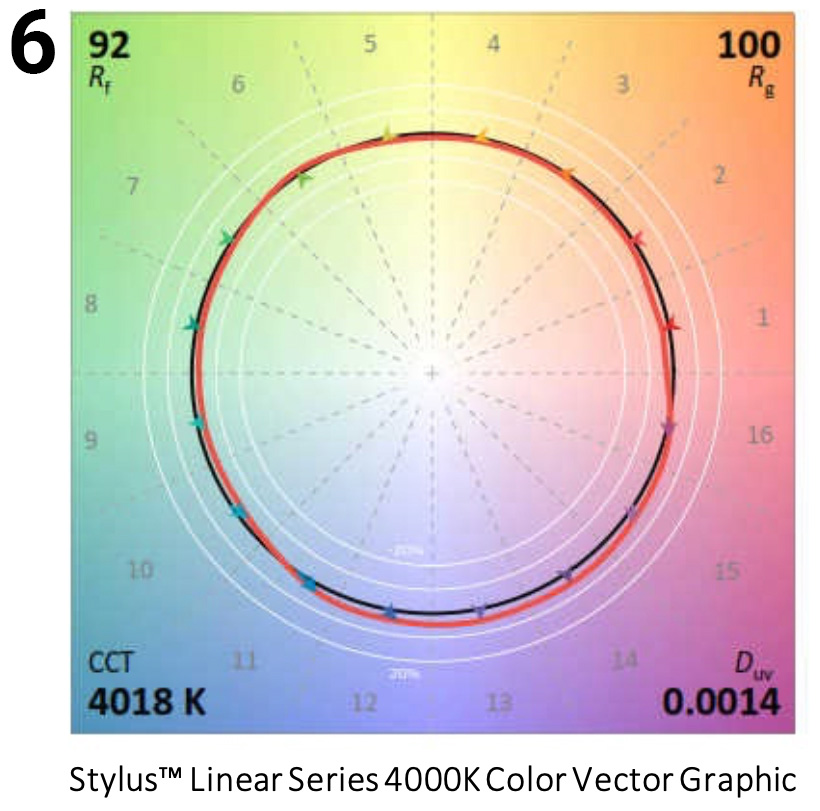
5 - The Rf score – The Styllus Linear™ Series 3000K and 4000K versions both score 92, telling us that the luminaires deliver excellent color fidelity. As TM-30’s counterpart to CRI, Rf scores will approximately correspond to CRI, although Rf should more accurately reflect an observer’s experience, since Rf is an average of 99 color samples versus CRI’s eight color samples, and Rf coordinates are plotted on a more modern color space.
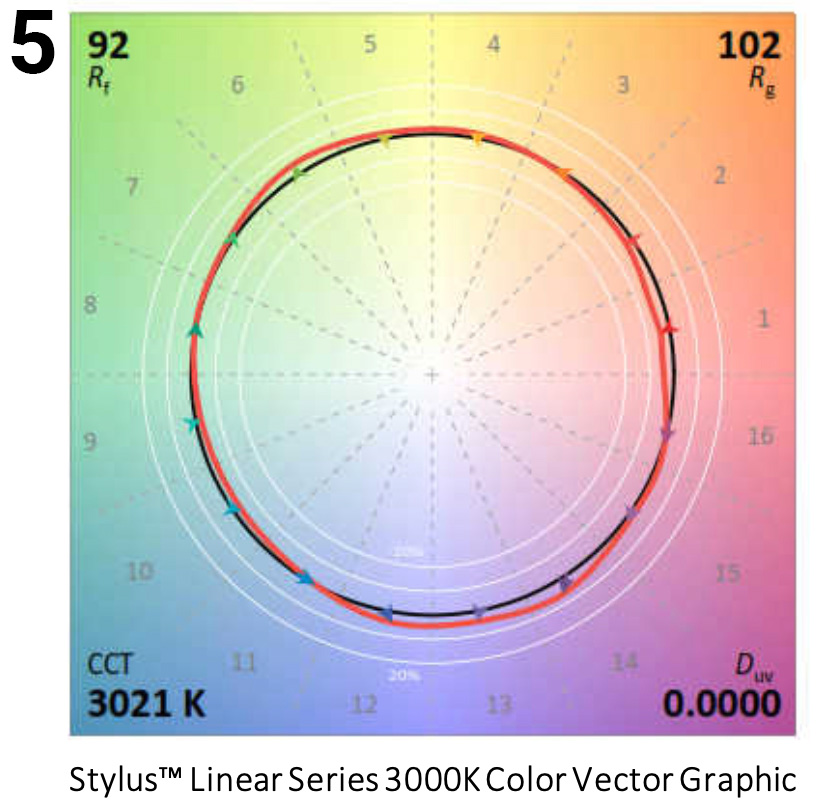
6 - The Rgscore – The Styllus Linear™ Series 3000K luminaire has an Rg value of 102, telling us that on average, colors are slightly more saturated than under the reference light – a desirable characteristic in many applications. (Because gamut is a relative value related to color preference, scores can be greater than 100.) The 4000K version’s Rg value is 100, telling us that on average, color saturation is on par with natural light.
In many applications, it’s desirable for a light source to boost saturation of parts of the spectrum to achieve more vivid colors. While the hues may not shift, the change in saturation invariably means that color fidelity is lower, so it’s important to remember that a “lower” fidelity score (Rf) may be an acceptable trade-off for more vivid colors (Rg). Also, because both Rf and Rg are overall averages, they don’t tell us which individual colors or parts of the spectrum will experience a shift in hue or gamut – or how much. The beauty of the Color Vector Graphic is that a quick glance provides a wealth of color rendering information beyond average values to show us exactly where the hue and gamut shifts are taking place.
Looking at the Color Vector Graphics, you’ll note the 99 color samples used in TM-30 are categorized into 16 hue bins. These are divided by dotted lines in the color space, descending in number clockwise from bin 16 at the 3 o’clock position.
The black circle in a Color Vector Graphic represents how colors appear under the reference light source. If you were to plot the color of each of the 99 samples used by TM-30 when viewed under the reference light, they’d all fall along this circle.
The red circle represents how colors appear under the test luminant, in this case, the Styllus Linear™ Series luminaires.
The concentric white circles represent the magnitude of the shift in gamut (saturation) from the reference source (black circle) as percentages.
Comparing the black and red circles gives us relative gamut information at a glance:
 Where the lines overlap, the gamut value will be 100, meaning that colors in this portion of the spectrum are neither oversaturated nor undersaturated compared to the reference.
Similarly, the directional arrows act as a simliar visual aid to quickly tell us about both gamut and hue shifts across each of the 16 hue bins:
- Arrows pointing outward (toward the outside of the color space) mean colors are more saturated than the reference.
- Arrows pointing inward (toward the center) mean colors are duller or more washed out than the reference.
- Arrows pointing sideways or angled inward/outward tell us the color has shifted hue from its natural appearance, and in what direction.
Armed with this detailed knowledge of how the Styllus Linear™ Series luminaires will render various parts of the spectrum, architects and designers can remove the guesswork from their lighting designs:
- Knowing that colors will render with a high degree of fidelity, designers can confidently choose textures, materials and objects for the lighted space.
- Knowing what hues will appear more vivid or muted allows the designer to create visual hierarchies and contrasts to better achieve the intent of the design.
- Comparing Color Rendition Reports for multiple luminaires under consideration ensures their color rendering properties will harmonize and complement objects and furnishings within the space.
So that’s the story behind “brilliant color quality.” By unpacking that phrase using TM-30 metrics, we find that architects and designers can specify the Styllus Linear™ Series secure in the knowledge that the luminaires will deliver exceptional color fidelity and balanced gamut levels to bring full expression to their vision.
As TM-30 metrics are more widely adopted across the lighting community, expect to see more TM-30 Color Rendition Reports from Cree Lighting. As you can imagine, we’re delighted to have objective, independent metrics backing up our claims to exceptional lighting quality.